Which function has better performance? while, for loop, or high-order function reduce?
I used this code to measure:
func processTime(_ title: String, closure: () -> ()) {
    let startTime = CFAbsoluteTimeGetCurrent()
    closure()
    let duration = CFAbsoluteTimeGetCurrent() - startTime
    print(title, "Duration = \(String(format : "%.4f", duration))")
}

processTime("for-in") {
  var sum = 0
  for i in 0..<10000000 {
    sum += i
  }
}

processTime("while") {
  var sum = 0
  var i = 0
  while i<10000000 {
    sum += i
    i += 1
  }
}

processTime("reduce") {
  let sum = (0..<10000000).reduce(0, +)
}
I run the code above in Debug mode, and here is the result:
// Debug mode

for-in Duration = 1.5586
while Duration = 0.0115
reduce Duration = 1.5766
The result makes me curious. I wonder why for-loop and reduce are so much slower compared to while🤔
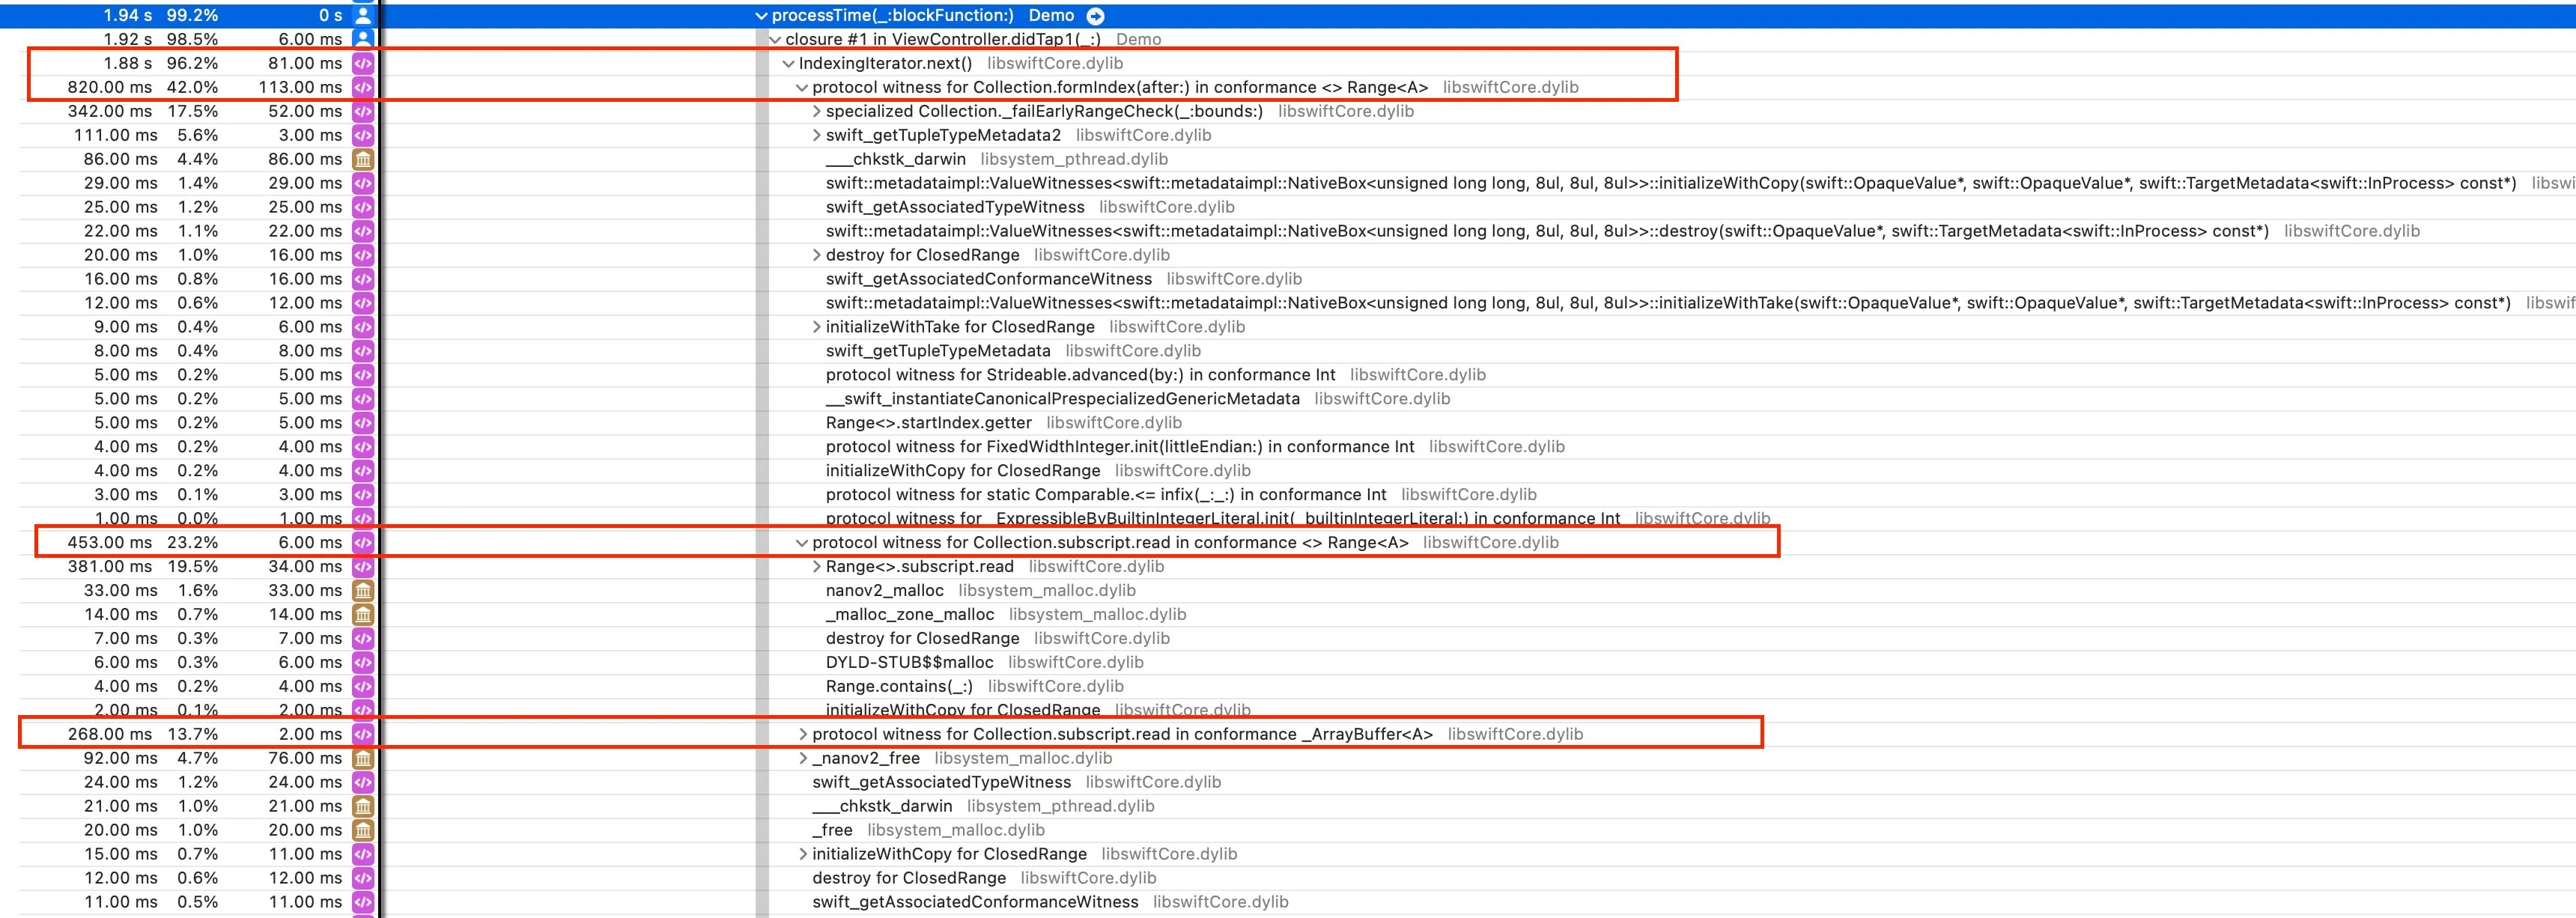
Let’s use our old friend Profiler Instruments to dig deeper.

We can see what for-loop does under the hood:
- For-loop will be converted to IndexingIterator
- For each call to the next index, it will trigger next() function. (97% of the time is spent on callingnext() function.)
- Each time trigger next, it calls a bunch of protocol methods (dynamic dispatch), which takes time to look at the witness table.
Cool, but why next() func uses dynamic dispatch? To find out, let’s look at the implementation details of IndexingIterator.
public protocol Collection: Sequence {
    ...
}

public struct IndexingIterator<Elements: Collection> {
    let _elements: Elements
}

extension IndexingIterator: IteratorProtocol, Sequence {
    public mutating func next() -> Elements.Element? {
        if _position == _elements.endIndex { return nil }
        let element = _elements[_position]
        _elements.formIndex(after: &_position)
        return element
    }
}
In the next() func, we use _elementsproperty. _elements could be any Collectionprotocol, so we don’t know which member _elements[_position] or _elements.formIndex refers to at compile time. Therefore, we must look at the vtable at runtime and use protocol witness.
After all, compare that to your while loop, which only needs to manage a single parameter and doesn’t need to perform any table look-up. It does less work, that’s why while loop has better performance than for-in and reduce .
Explore the Swift compiler
Now, let’s come to the fun (or headache) part. 🥸
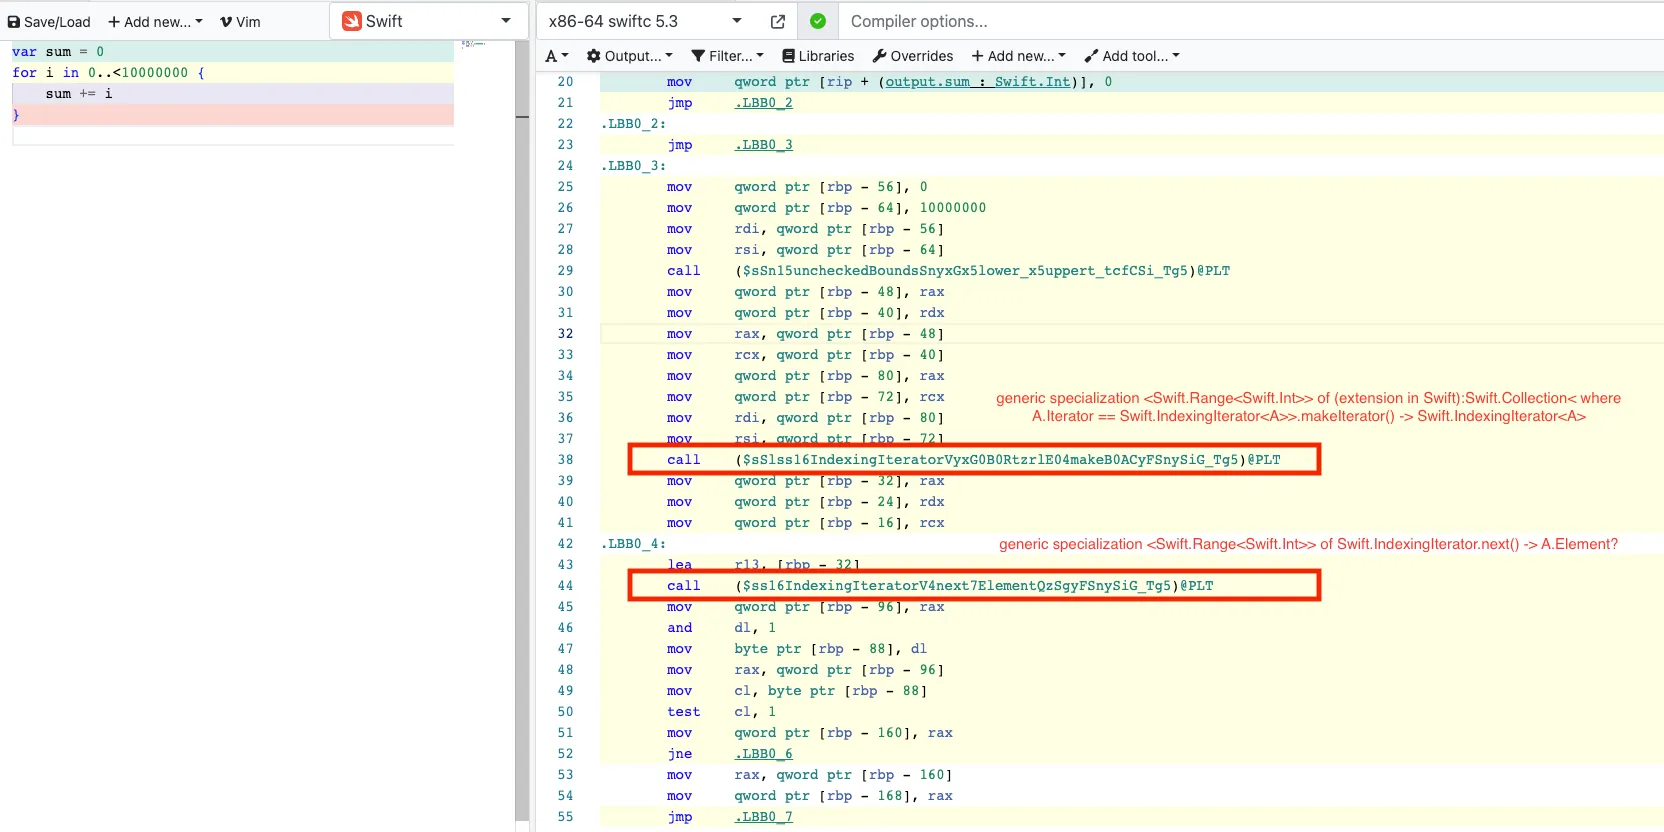
Instead of using Instruments, you can also use godbolt tool to understand how the code is compiled:

Yeah, I know it’s a bit hard to read all of these 🥲
But for now, just only focus on line 38 and line 44. These are function names that the compiler has mangled. To trace back the originally readable text, we can use swift-demangle tool.

Now we know that when Swift compiles for-in will be translated to:
let range: Range<Int> = 0..<10000000
let iterator = range.makeIterator()
while iterator.next() {
  ...
}
Feel yourself as a Swift compiler master already? 😎
So we’ve learned that while loop has better performance than for-in and reduce in Debug mode. How about Release mode, where we turn on some compiler optimization?
// Release mode

for-in Duration = 0.0063
while Duration = 0.0053
reduce Duration = 0.0075
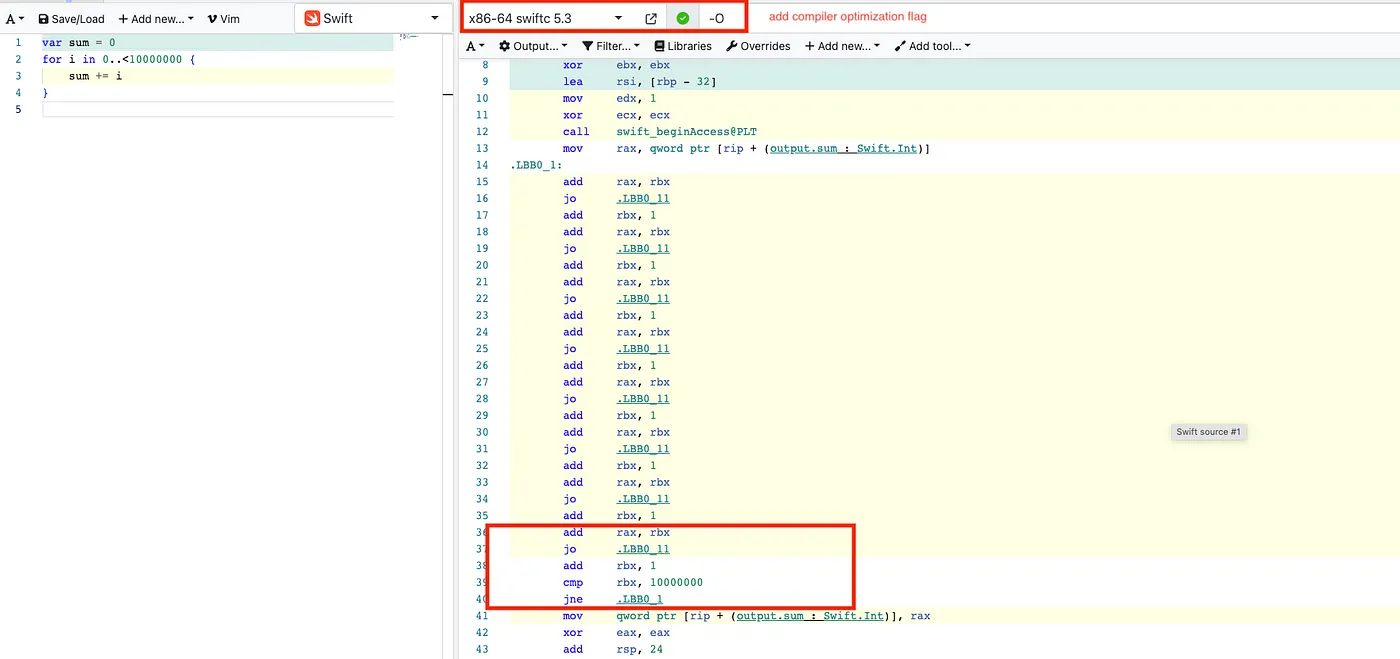
To know the reason, we can use godbolt tool to compare the compiled version.

With compiler optimization enabled, Swift doesn’t need to perform a bunch of dynamic dispatch. All Swift needs to do is manage a counter variable, increase it by 1, perform the sum action, and repeat until it reaches the limit. 🚀
Tips
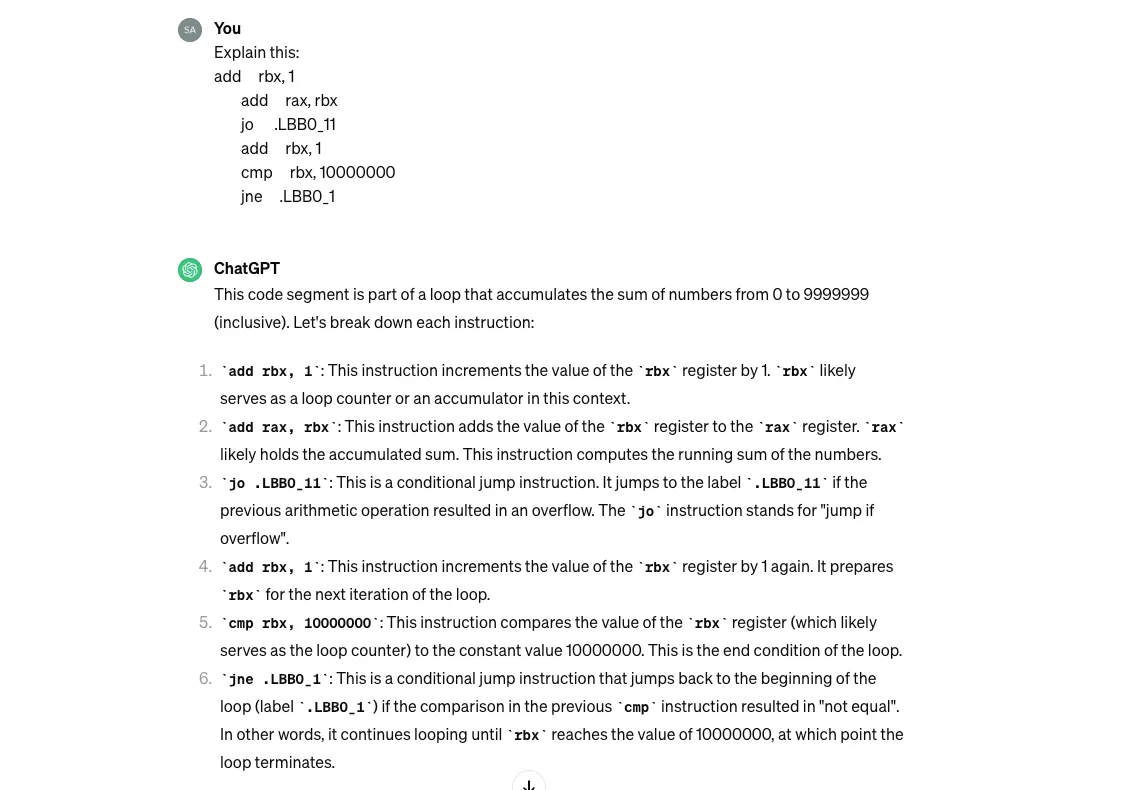
If you don’t know how to read SIL (same as me), you can ask your good friend ChatGPT for help 😛

What we’ve learned?
- This is a friendly reminder that Profiler Instrument is a useful tool for debugging application performance.
- To measure your app performance, measure it in Release mode.
- Introduce you to the Swift compiler

