This article will not mention how to use the Memory Graph Debugger to identify and fix leaks. I know we already had enough articles for that.
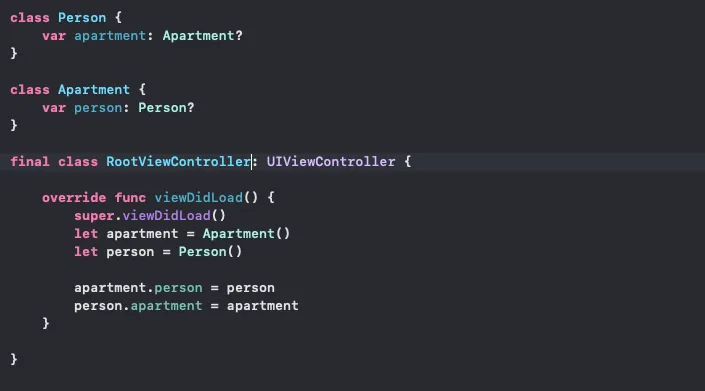
Before going to the main part, let’s take a look at this piece of code and answer this question: “Do we have any leak here?”
final class Person {
    var apartment: Apartment?
}

final class Apartment {
    var person: Person?
}

// This is the root view controller of the application
final class RootViewController: UIViewController {

    private let apartment = Apartment()
    private let person = Person()

    override func viewDidLoad() {
        super.viewDidLoad()

        apartment.person = person
        person.apartment = apartment
    }

}
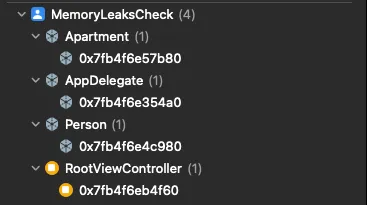
The answer is NO. You can verify with Memory Graph Debugger

You may ask: “Wait, what? We have a retain cycle right here, how it can’t be a leak?”
Not all retain cycles are leaks.
A leak is a piece of memory for which there are no references to the allocation from any live object in the application’s live object graph.
I.e. the memory is unreachable and, thus, there is no way that it can ever be referred to again (barring bugs). It is a dead memory.
To summarize, if we can still access the object, it’s not a leak. In the piece of code above, we can still access to apartment & object from the view controller, so it’s not a leak.
Here is an example of a leak. After the viewDidLoad, we can’t ever access to apartment & person, but these objects will not be deallocated due to the retain cycle.

Now you may think: “In the first example, there’s nothing to worry about. Although we have a retain cycle between apartment & person, this is the root view controller of the application. The view controller will never be deallocated, so apartment & person will never be deallocated anyway. Nothing can go wrong.”
Well, not so fast.
The problem
Let’s consider this scenario I’ve met recently:
- Our app has a root ViewController & root ViewModel. The ViewModel has a retain cycle itself silently. Note that since this is root ViewModel, we always can access this ViewModel: AppDelegate -> window -> rootViewController -> viewModel. So this view model is not a leak.
- We went through almost every flow in the app, opened Memory Graph Debugger to check, and the Debugger showed there weren’t any leaks.
We thought the app was soooo fine and we were sooooo ready for the release 🚀
But we were wrong.
We only went through almost every flow. We forgot 1 simple flow, which we think wasn’t important. It’s “Logout then Re-login” flow.
The problem is that after the user performs the re-login flow, we create a new root ViewController & ViewModel. Because of that, we lose the reference to the current root ViewModel. And yes, it used to be fine, but now it has become Leak Memory and is ready to destroy our app 🤧.
Even worse, the ViewModel keeps references to many different services, and since we’re using the publish/subscribe mechanism across the app, the leaked view model & leaked services kept emitting a lot of events. 💥
To summarize, I think we have these problems:
- It’s tricky to find retain cycles that do not introduce a leak. Memory Graph Debugger only helps to find leaks.
- Retain cycle can easily introduce leaks if we do not pay enough attention.
- Going through every flow in the app and checking for leaks manually is boring, painful & easy to forget some special flow.
- And to be honest, engineers do not often use Memory Graph Debugger to check for leaks in daily development. Example: We have a bunch of leaks in our current project due to the custom navigator framework, but we don’t even know because we never use Memory Graph Debugger.
It makes me wonder: “Can I come up with a solution that can automate the leak-checking process?”

Solution
My simple idea is:
- Use a UI testing framework to simulate the flow in the application
- Use the leaks tool provided by Apple to generate a memgraph. (more about this later)
- Write a script to process the generated memgraph to check for leaks. If there any leaks are found, use Danger to mark the PR as failed or post a message to Slack.
Let’s take a closer look at each step
Use a UI testing framework to simulate the application flow
Why do we need to use a UI Testing framework?
Imagine we’re checking for leaks manually. So what we will do is go through every flow in the app, then use the Memory Graph Debugger to check for leaks, right?
So, the UI Testing framework will help us to simulate the application flow automatically.
For the demo project, I decided to use Maestro to support me in simulating the application flow.
For the reason why I chose Maestro, or if you want to use another UI testing framework, please take a look at my project for more information. (The link to the project will be attached at the end of this article)
Here are the link to the demo video: https://vimeo.com/870326305
Use the leaks tool to generate a memgraph
What is a memgraph file?
A memgraph file is essentially a snapshot of your process’s address space at an instance in time. Memgraphs record the address, size, stack trace, and references of each virtual region and each allocated malloc block.
leaks tool is a tool provided by Apple to generate a memgraph file from a running program and process the memgraph file.
You can learn more at this WWDC 2018 talk and WWDC 2021 talk.
So, after we ran the UI test, now we have a running program. It’s easy to generate a memgraph using the leaks tool:
leaks $PROGRAM_NAME --outputGraph=$MEMGRAPH_PATH
If you open the generated memgraph file, you will get the result same as when you use the Memory Graph Debugger.

With this memgraph file in our hand, we can easily check if the project has any leaks.
Process the generated memgraph
For this step, I used Swift to write an executable program. The main idea of this program is to use the leaks tool to process the generated memgraph to find leaks
leaks $MEMGRAPH_PATH -q
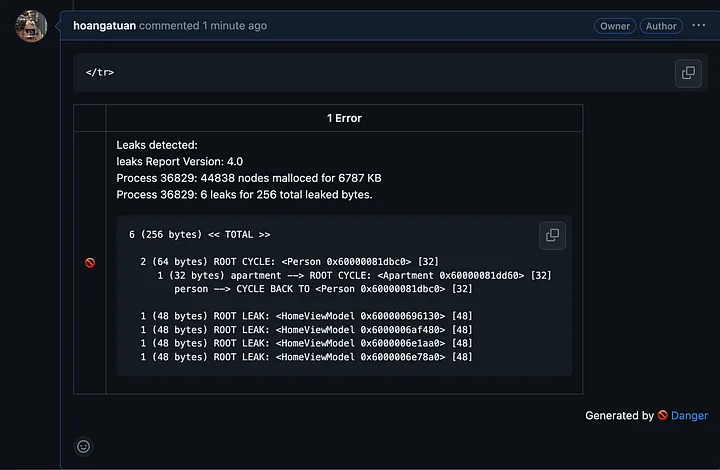
The output of the script will be like this

The executable program will handle this output. If it finds any leaks, it will mark the PR as failed or notify engineering team.
Integrate into your CI workflow
To integrate into your CI workflow, all you need to do is execute this script:
leaksdetector --process-name $PROCESS_NAME --executor-type maestro --maestro-flow-path ./maestro/leaksCheckFlow.yaml -d $DANGER_PATH
Result

Conclusion
You can find the source code here.
If you feel interested in this solution, don’t hesitate to contribute to the project ^^

